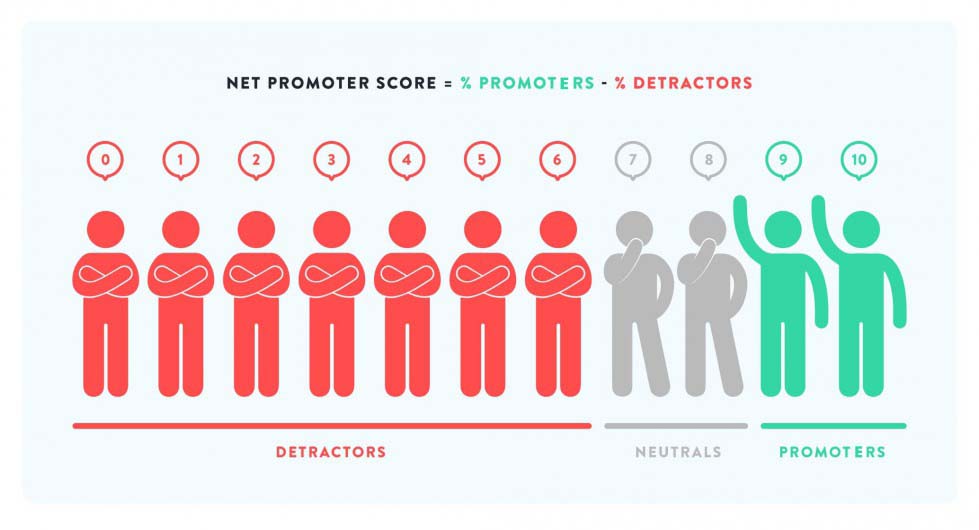
As a firm specialized in analyzing feedback from people, OpenMet carries out a lot of projects and surveys to assess customer satisfaction or experience measuring NPS (Net Promoter Score).
When we conduct surveys and studies on employee satisfaction, motivation and work environment, we increasingly include eNPS (employee Net Promoter Score).
This blog post will attempt to outline the main relationships, similarities and differences between these two metrics.
1. Similarities between NPS and eNPS
The two metrics use an identical calculation system (see the blog post “NPS: What is it and What are its Pros and Cons?” for more details), classifying customers or employees as Promoters, Passives, and Detractors. The questions are the same: in one case they ask customers about recommending a product or service and in the other they ask employees about recommending the company.
The intention behind NPS methodology is to use this metric frequently and regularly for a quick analysis of the return on investment of changes made to improve the customer experience. The idea is that eNPS should also be a flexible, frequent system with very few additional questions. The intention here is to measure employee engagement and analyze departmental results in focus groups or chats with employees who must lead the company to improvement using the “bottom-up” approach, in contrast to the traditional “top-down” approach of environment studies, where the company management analyzes the results of the work environment study and then develops a plan of action to roll out over the next few months.
2. Cross relations between NPS and eNPS
The influence of work environment on customer satisfaction has been known for some time. Some studies (such as the article “Employee Engagement: The Wonder Drug For Customer Satisfaction”) set this correlation at high levels (r=0.43).
Although we do not yet have data linking NPS and eNPS, we can make an educated guess that their correlation indexes are also high. Therefore, one might expect that increases/decreases in eNPS will lead to increases/decreases in NPS and vice versa.
3. Differences between NPS and eNPS
While feedback from NPS is normally associated with a particular customer (with all their data: revenues, segmentation, etc.), eNPS data are anonymous, as is typical of all work environment and employee satisfaction surveys. Only aggregate information (e.g. department-based) can be analyzed and hence, exploited. This results in a lower traceability for eNPS and a less precise ability to calculate the return on the corrective actions we take.
The popularity and implementation of NPS is high, while that of eNPS is still very low. In most satisfaction and work environment studies, indexes with a number of questions are still used, which are generally more robust than NPS systems and cover many more areas.
eNPS results are generally lower than those of NPS. In our experience, eNPS is typically negative (across the board), while NPS evaluations are often close to 0 and even positive in many cases. Apparently, people tend to demand more from their employers than their suppliers, although we must consider the fact that the importance and emotional involvement of a person with their daily work is far greater than that associated with the use of products and services, which are generally used sporadically in comparison with working life.
Conclusion
NPS and eNPS share many similarities and there are strong reasons to believe that they are highly interrelated. Just as NPS is becoming a very popular metric, we expect that the use of eNPS – still up and coming – will become increasingly common, especially for the relatively frequent measurement of employee motivation/satisfaction or work environment. Their results are not directly comparable, since the result of eNPS is usually lower than that of NPS.
More information on Customer Satisfaction.


One thought on “NPS and eNPS: Similarities, Relationships and Differences”
Comments are closed.